Create Charts and Visualizations with ChatGPT
248 views
Featured Image
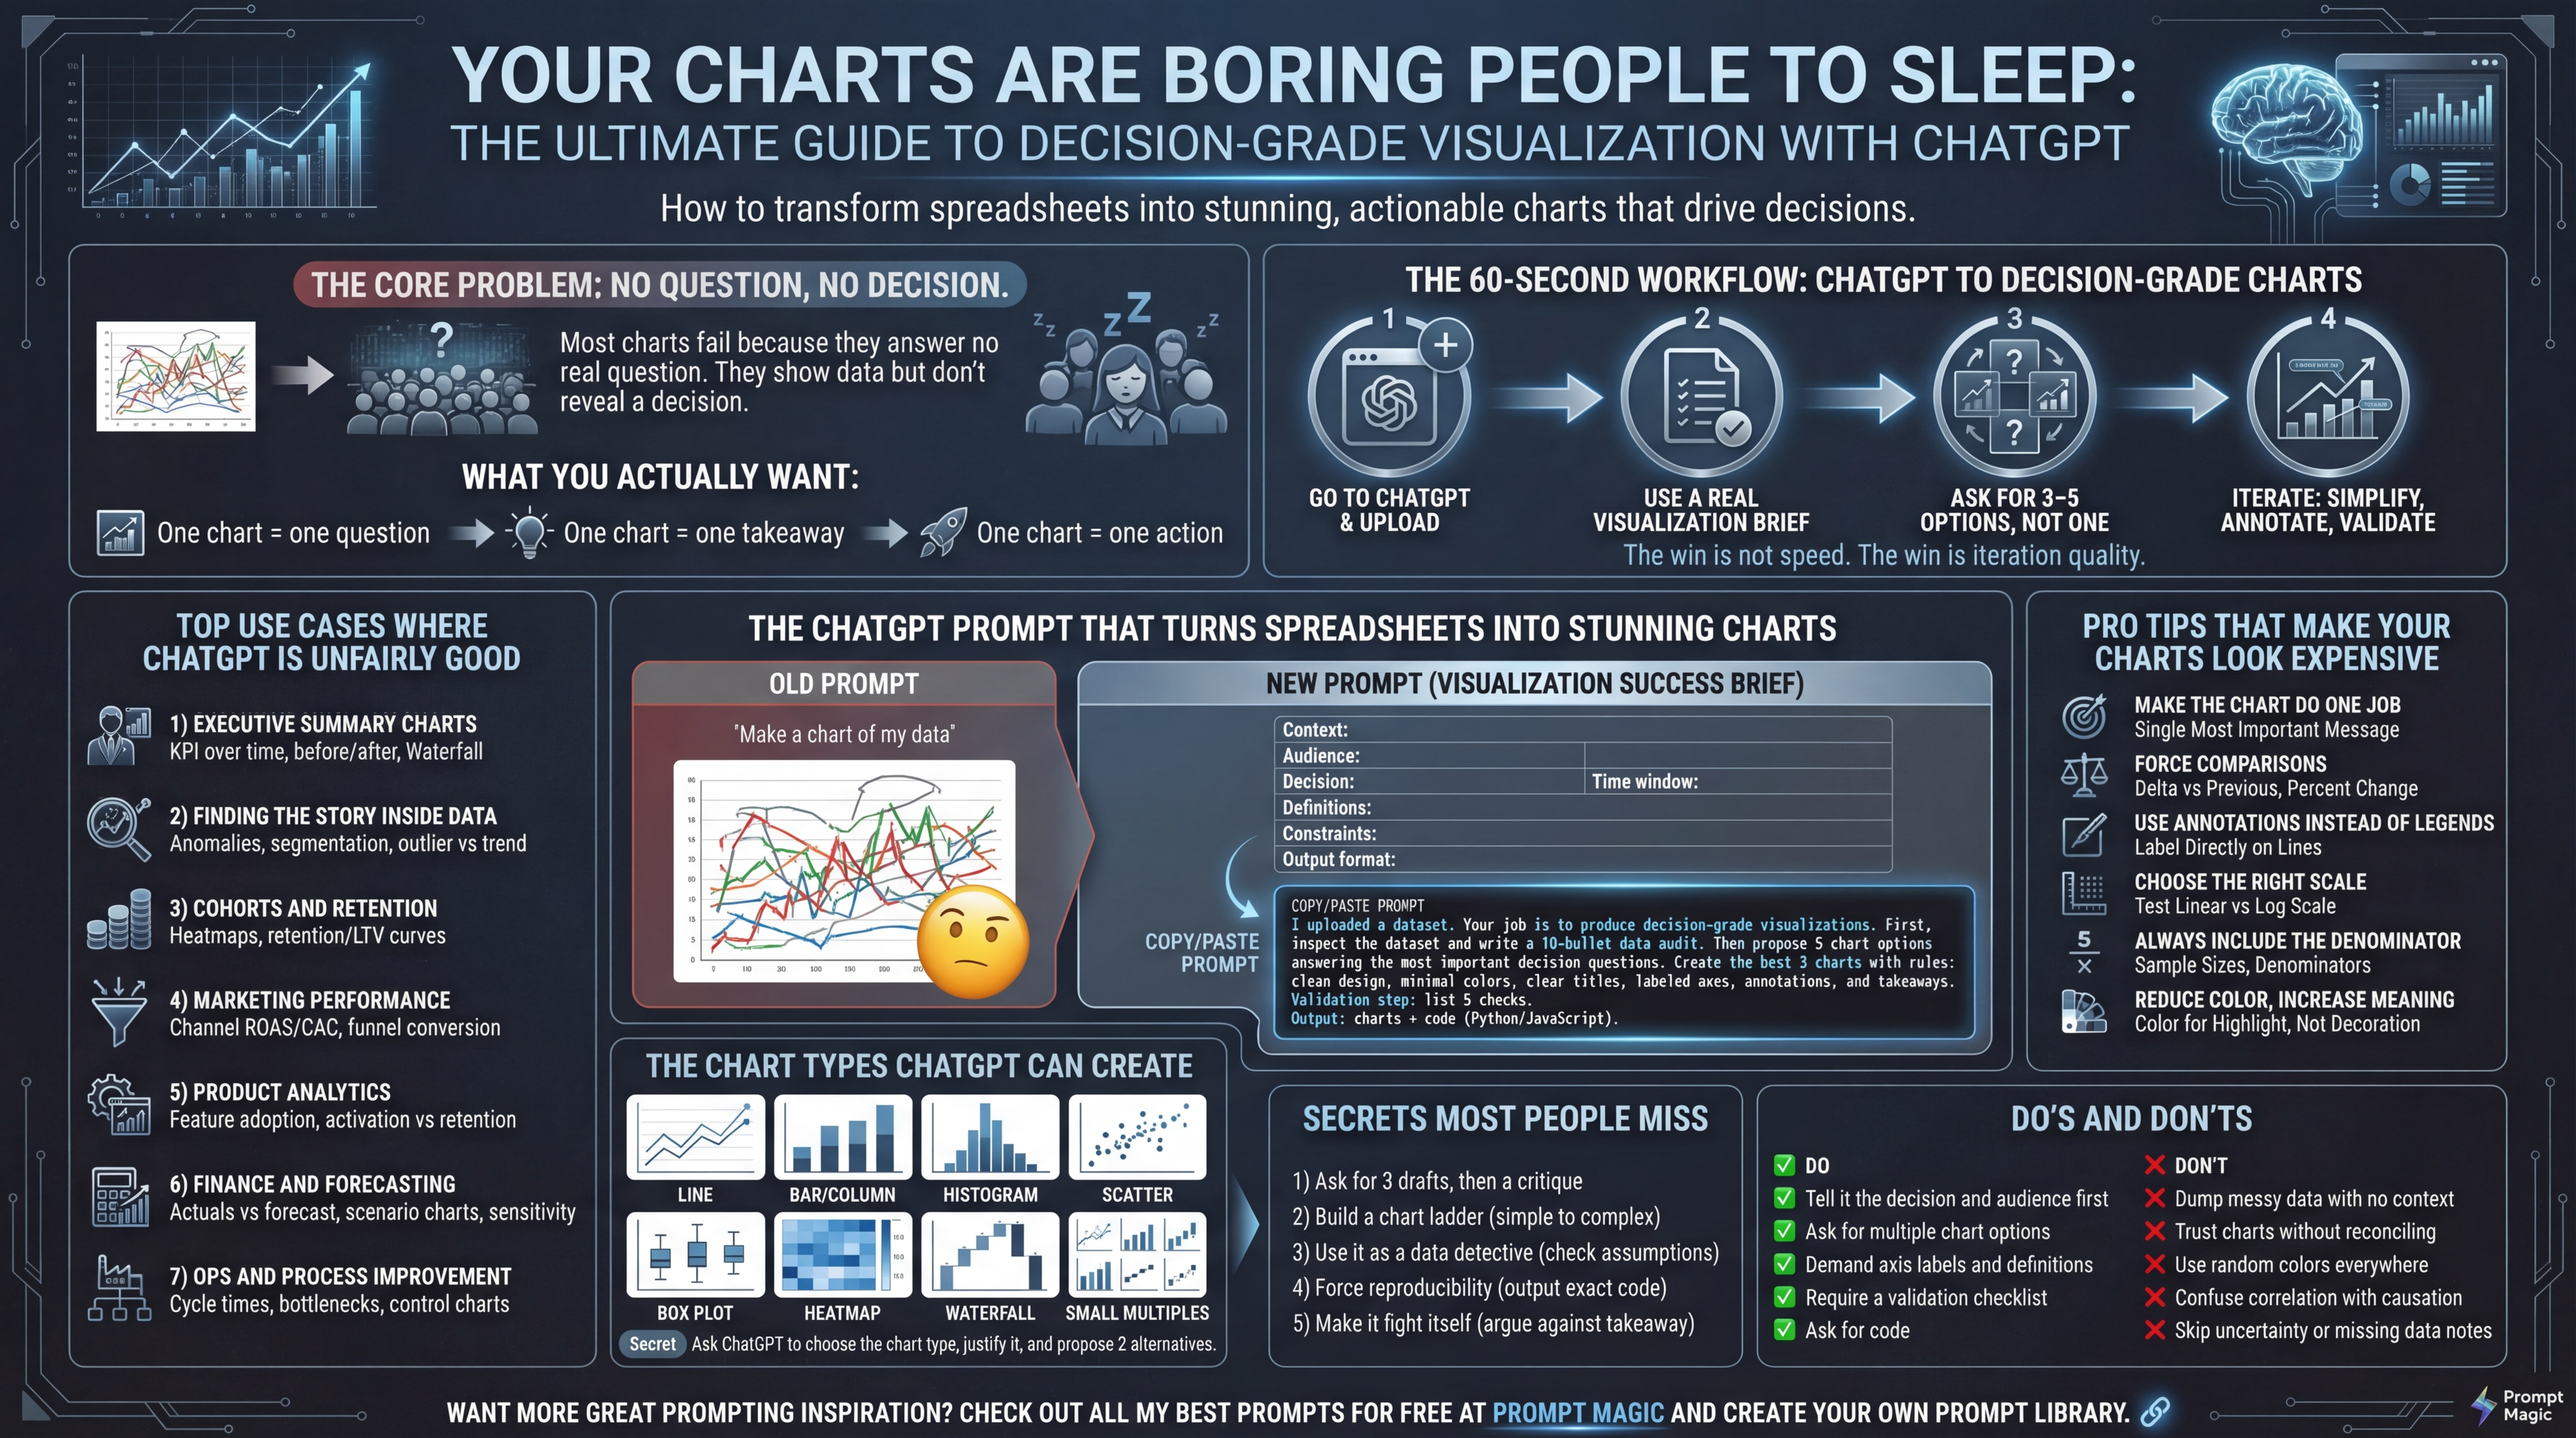
Visualization Success Brief Context: what this dataset represents in plain English Audience: who will see the chart (exec, analyst, customer, team) Decision: what decision this chart should drive Time window: what time period matters Definitions: metrics, units, and any business logic Constraints: styling, number of charts, layout, labeling rules Validation: checks to confirm correctness before finalizing Output format: chart + insights + (optional) code